
Are you looking for low-risk, high-reward option strategies to grab 100 points on Nifty?
Today, we’ll explain Bull Butterfly and Bear Butterfly strategies perfect for BTST (Buy Today, Sell Tomorrow) and STBT (Sell Today, Buy Tomorrow) trades.
If you’re a short-term trader hunting for precision strategies, this guide is for you!
📚 What is a Bull Butterfly Option Strategy? (In-Depth)
A Bull Butterfly Spread is a limited-risk, limited-reward strategy that profits if the stock/index (like NIFTY) moves moderately higher toward a specific level by expiry.
It uses Call Options.
🔹 Structure of Bull Butterfly:
You create it by combining:
- Buy 1 ITM (In-the-Money) Call
- Sell 2 ATM (At-the-Money) or slightly OTM (Out-of-the-Money) Calls
- Buy 1 OTM (Out-of-the-Money) Call
✅ All three strikes are equidistant from each other.
🔹 Strike Selection Based on Current Spot (NIFTY 24,008):
| Term | Meaning | Example Strike | Explanation |
|---|---|---|---|
| ITM (In-The-Money) | Option with strike price below spot price | 24250 CE | Buy 1 lot |
| ATM (At-The-Money) | Option with strike price near spot price | 24500 CE | Sell 2 lots |
| OTM (Out-Of-The-Money) | Option with strike price above spot price | 24750 CE | Buy 1 lot |
- Gap between strikes = 250 points here (24250 ➔ 24500 ➔ 24750).
- Notice: Perfect symmetric structure around 24500.
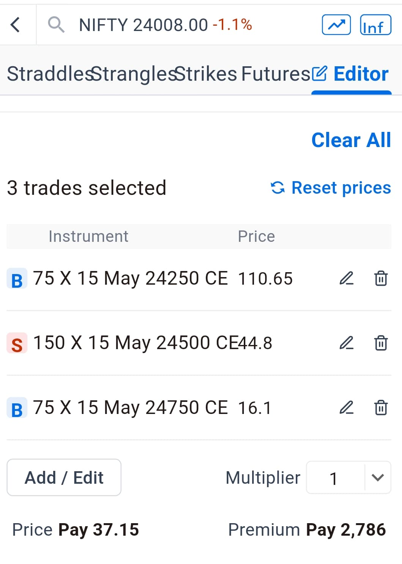
🔹 Bull Butterfly Setup Example (From Your Screenshot):
| Action | Strike | Option Type | Price (approx) |
|---|---|---|---|
| Buy | 24250 CE | Call | ₹110.65 |
| Sell | 24500 CE (×2) | Call | ₹44.80 each |
| Buy | 24750 CE | Call | ₹16.10 |
➡️ Net Debit (Premium Paid) = ₹37.15 per quantity.
🔥 Key Features:
- Risk: Limited to the net premium paid (₹2,786 approx for 1 lot of 75 units).
- Reward: Limited (maximum at 24500 strike).
- Breakeven Points:
- Lower Breakeven = Lower Buy Strike + Net Premium
- Upper Breakeven = Upper Buy Strike – Net Premium
📊 Breakeven Example:
- Lower Breakeven = 24250 + 37 ≈ 24287
- Upper Breakeven = 24750 – 37 ≈ 24713
👉 You make maximum profit if NIFTY closes around 24500 at expiry.
📈 Payoff Chart:
The payoff graph looks like a tent (sharp peak at the center strike).
🔹 Before 24287: Small loss (max loss = premium paid).
🔹 Between 24287 to 24713: Profit zone, max at 24500.
🔹 After 24713: Again small loss (premium paid).
🧠 Why Gap Between Strikes Matters?
- Smaller Gap (like 100 points): Lower reward, lower risk, tighter range.
- Bigger Gap (like 250 points): Higher reward, broader range, but slightly costlier.
- Best choice for BTST/STBT: Gap between 150-300 points.
➡️ In your case, 250 points is a good setup for current volatility and 1-2 day expiry move.
✨ Pros and Cons of Bull Butterfly:
| Pros | Cons |
|---|---|
| Very limited risk | Limited profit even if NIFTY rallies a lot |
| Easy to manage | Needs correct expiry targeting |
| Works well with 1-3 day view | Not suitable if very big move expected (beyond wings) |
| Low capital usage (low margin) | Complex to adjust midway |
🚀 Practical Example:
Suppose NIFTY moves from 24,008 to 24,500:
- 24500 CE will expire worthless (since sold 2x at good premium).
- Your bought 24250 CE will be worth about 250 points intrinsic value.
- Your bought 24750 CE will expire worthless.
- Net payoff = (250 – Net Premium Paid)
= 250 – 37 ≈ 213 points profit
Multiply by lot size 75 → ₹15,975 approx.
✅ ATM Strike Selection: Real Concept
ATM (At-The-Money) strike is the strike closest to the current market price.
- Current Market Price (CMP) = 24,008
- So ATM strike = 24,000, not 24,500.
👉 24000 Strike is ATM here.
❓ Then Why 24500 in Butterfly Example?
Good catch!
The butterfly strategy you showed (with 24250/24500/24750) is actually built slightly OTM (Out of the Money), not exactly ATM.
This is common when:
- You expect the market to move UP moderately (i.e., bullish bias).
- You build butterfly “ahead” of the current price to catch that up-move.
In this case:
- 24500 is not ATM — it’s a target strike.
- It’s strategically chosen because you expect the market to rise from 24008 toward 24500 by expiry.
🎯 More Accurate Butterfly Setup Based on 24008:
If you wanted a pure ATM butterfly (without directional bias), based on 24008 spot:
You should ideally build around 24000 strike like:
| Action | Strike | Explanation |
|---|---|---|
| Buy | 23750 CE | Lower wing |
| Sell 2x | 24000 CE | ATM center |
| Buy | 24250 CE | Upper wing |
OR even better:
| Action | Strike |
|---|---|
| Buy | 23900 CE |
| Sell 2x | 24000 CE |
| Buy | 24100 CE |
If 100-point gaps available.
🧠 In summary:
| Concept | Correct Info |
|---|---|
| ATM Strike | Closest strike to Spot (here 24000) |
| 24500 Strike | OTM Strike (targeting future upmove) |
| Type of Butterfly | OTM Bullish Butterfly, not pure ATM |
📢 Important Practical Tip:
✅ If Neutral view ➔ Build ATM Butterfly (center at 24000).
✅ If Mild Bullish view ➔ Build OTM Butterfly (like 24500 center).
You are building the butterfly where you expect the index to move by expiry, not always exactly at spot.
🔥 Final Line:
👉 24,000 is ATM.
👉 24,500 is a bullish target OTM strike, used for Bull Butterfly based on view.
- Both ATM Butterfly Setup (for neutral market)
- OTM Bullish Butterfly Setup (for bullish market)
📊 ATM Butterfly vs OTM Bullish Butterfly (NIFTY 24008 Example)
| Feature | ATM Butterfly | OTM Bullish Butterfly |
|---|---|---|
| 🎯 Market View | Neutral (expect sideways move) | Mild Bullish (expect upmove) |
| 📈 Spot Price | 24,008 | 24,008 |
| 🎯 Center Strike | 24,000 CE (ATM) | 24,500 CE (OTM) |
| 🛠 Structure | Buy 1 lot 23750 CE Sell 2 lots 24000 CE Buy 1 lot 24250 CE | Buy 1 lot 24250 CE Sell 2 lots 24500 CE Buy 1 lot 24750 CE |
| 📦 Distance Between Strikes | 250 points each side | 250 points each side |
| 🔥 Maximum Profit | When NIFTY closes exactly at center strike (24000 or 24500) at expiry | When NIFTY closes exactly at 24500 at expiry |
| 📉 Maximum Loss | Limited (if NIFTY moves too far away from center, either side) | Limited (if NIFTY falls badly or rises too much) |
| 💸 Cost (Net Premium Paid) | Moderate | Moderate |
| 📈 Payoff Shape | Tent-shaped Profit/Loss graph | Tent-shaped, shifted higher |
🧠 Calculation Example (Assume 100 Points Movement Favorably)
Suppose NIFTY moves:
- From 24008 to 24108 → ATM Butterfly gains slightly.
- From 24008 to 24508 → OTM Bullish Butterfly gains heavily.
If expiry closes at 24000 or 24500, you get maximum profit.
✨ Pros and Cons
| ATM Butterfly | OTM Bullish Butterfly |
|---|---|
| ✅ Good for range-bound markets | ✅ Good for trending (mild bullish) markets |
| ❌ If strong trend comes, loss | ❌ If market falls, loss |
| ✅ Cheaper to set up | ✅ Slightly higher chance if bullish view |
| ❌ Need precise expiry prediction | ❌ Need expiry near target strike |
📌 Conclusion
| You should use… | If… |
|---|---|
| ATM Butterfly | You think NIFTY will hover around 24000 till expiry |
| OTM Bullish Butterfly | You think NIFTY will rally towards 24500 |
📈 Bull Butterfly and Bear Butterfly – Profit Calculation (Assuming Favorable Movement 100-1000 Points)
✅ Current NIFTY Spot: 24,008
1. 🔵 Bull Butterfly Strategy (Expecting Up Move)
Positions:
- Buy 24250 CE (₹110.65)
- Sell 2 × 24500 CE (₹44.80)
- Buy 24750 CE (₹16.10)
Net Premium Paid: ₹37.15 × 75 lot size = ₹2,786
📊 If NIFTY moves UP:
| NIFTY Spot | Status | Approx P&L |
|---|---|---|
| 24,100 (+100 points) | Below 24250 | Minor loss (~Premium paid) |
| 24,250 | At Lower Buy Strike | Small loss (close to premium) |
| 24,500 (Perfect Target) | Middle Strike Hit | 🎯 Maximum Profit! |
| 24,750 | Upper Strike Hit | Profit reduces |
| 25,000 (+1000 points) | Beyond 24750 | Only small loss (~Premium paid) |
🔥 Maximum Profit Calculation (At 24500):
- Difference between buy and sell strikes = (24500 – 24250) = 250 points
- Max Gain = 250 – Net Premium
- Max Gain = 250 – 37.15 ≈ 212.85 points
- ₹212.85 × 75 = ₹15,963 Profit
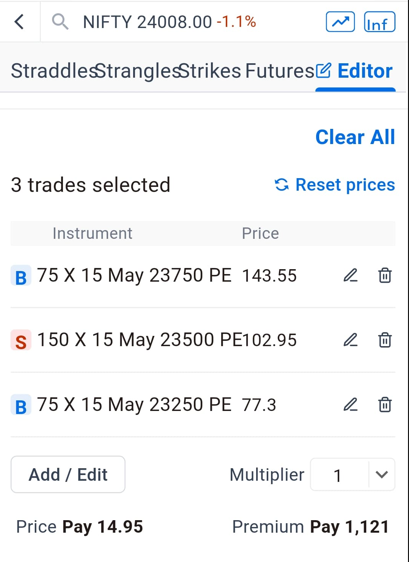
2. 🔴 Bear Butterfly Strategy (Expecting Down Move)
Positions:
- Buy 23750 PE (₹143.55)
- Sell 2 × 23500 PE (₹102.95)
- Buy 23250 PE (₹77.30)
Net Premium Paid: ₹14.95 × 75 lot size = ₹1,121
📊 If NIFTY moves DOWN:
| NIFTY Spot | Status | Approx P&L |
|---|---|---|
| 23,900 (-100 points) | Above 23750 | Minor loss (~Premium paid) |
| 23,750 | At Higher Buy Strike | Small loss (close to premium) |
| 23,500 (Perfect Target) | Middle Strike Hit | 🎯 Maximum Profit! |
| 23,250 | Lower Strike Hit | Profit reduces |
| 23,000 (-1000 points) | Beyond 23250 | Only small loss (~Premium paid) |
🔥 Maximum Profit Calculation (At 23500):
- Difference between buy and sell strikes = (23750 – 23500) = 250 points
- Max Gain = 250 – Net Premium
- Max Gain = 250 – 14.95 ≈ 235.05 points
- ₹235.05 × 75 = ₹17,628 Profit
✨ Quick Summary Table:
| Movement | Bull Butterfly (₹) | Bear Butterfly (₹) |
|---|---|---|
| +100 points up / -100 points down | Minor Loss or Break-Even | Minor Loss or Break-Even |
| +250 points up / -250 points down | 🎯 Max Profit (~₹15k-₹17k) | 🎯 Max Profit (~₹15k-₹17k) |
| +500 points up / -500 points down | Partial Profit | Partial Profit |
| +1000 points up / -1000 points down | Small Loss (Premium Paid) | Small Loss (Premium Paid) |
🚀 Key Takeaways:
✅ You grab max profit if NIFTY moves toward your center strike (24500 CE or 23500 PE).
✅ Even if NIFTY moves too much, loss is limited to small premium (₹2,786 or ₹1,121).
✅ Best strategy for BTST and STBT traders expecting short-term directional move within 1-2 days.
📈 Bull Butterfly and Bear Butterfly – Loss Calculation (100 to 1000 Points Against Move)
In both the Bull Butterfly and Bear Butterfly, maximum loss = Net Premium Paid, even if Nifty moves 100, 500, or 1000 points against your view.
| Movement Against | Bull Butterfly (Loss ₹) | Bear Butterfly (Loss ₹) |
|---|---|---|
| 100 Points | ₹2,786 | ₹1,121 |
| 200 Points | ₹2,786 | ₹1,121 |
| 500 Points | ₹2,786 | ₹1,121 |
| 1000 Points | ₹2,786 | ₹1,121 |
✅ Key: Your loss does not increase beyond the premium paid even if Nifty drastically moves wrong (big gap ups or gap downs).
1. Bull Butterfly Example (Nifty Falls)
- Buy 24250 CE (₹110.65)
- Sell 2 × 24500 CE (₹44.80)
- Buy 24750 CE (₹16.10)
- Net Premium Paid: ₹37.15 × 75 lot size = ₹2,786
Wrong Movement Cases:
- If Nifty falls 100 points → Loss ₹2,786
- If Nifty falls 500 points → Loss ₹2,786
- If Nifty crashes 1000 points → Still Loss ₹2,786
2. Bear Butterfly Example (Nifty Rises)
- Buy 23750 PE (₹143.55)
- Sell 2 × 23500 PE (₹102.95)
- Buy 23250 PE (₹77.30)
- Net Premium Paid: ₹14.95 × 75 lot size = ₹1,121
Wrong Movement Cases:
- If Nifty rises 100 points → Loss ₹1,121
- If Nifty rises 500 points → Loss ₹1,121
- If Nifty jumps 1000 points → Still Loss ₹1,121
🔥 Pros and Cons Table:
| Feature | Bull Butterfly | Bear Butterfly |
|---|---|---|
| Best Market View | Bullish | Bearish |
| Maximum Loss | Fixed (₹2,786) | Fixed (₹1,121) |
| Maximum Profit | High, if spot near middle strike | High, if spot near middle strike |
| Risk Management | Very Strong | Very Strong |
| Margin Required | Only Premiums | Only Premiums |
| Ideal For | BTST (Buy Today Sell Tomorrow) | STBT (Sell Today Buy Tomorrow) |
✨ Why Use Butterfly Strategy in BTST / STBT?
- Risk Defined: You know maximum loss before entering.
- Lower Margin: No heavy blocking like futures.
- Volatile Market Friendly: Safe even if market gaps opposite side.
- Rewarding: Captures decent moves near the middle strike.
📊 Conclusion: Safe Trading Even If Market Moves 1000 Points Wrong!
✅ With a Bull or Bear Butterfly, even a massive wrong move of 1000 points will not wipe you out.
✅ Small fixed premium risk for potentially good reward — perfect for BTST and STBT traders!
Why Butterfly Strategy is Ideal for BTST/STBT?
- Limited risk, unlimited peace of mind.
- Low premium required compared to buying naked options.
- High reward potential if Nifty moves smartly.
- Controlled margin – Best for small traders also.
Conclusion
Both Bull Butterfly and Bear Butterfly are amazing for capturing 100 points BTST/STBT trades in Nifty.
You invest small premiums (~₹1,000–₹2,500) but can make 5x–7x returns with the right move.
🔵 Use Bull Butterfly when expecting a moderate upmove.
🔴 Use Bear Butterfly when expecting a moderate downmove.
Tip: Always adjust strikes slightly based on market volatility to maximize profits.